Scalping Trend Scanner

Specially designed for Scalping & Risk Takers.

Scalping Trend Scanner

FEATURES OF SCANNER

  • Generate Signal for Intraday Only.
  • 2-3 Signals per day with Small Targets & SL.
  • Scan Up to 100 Stocks & Commodity in Live Market,
  • Give Buy-Sell Levels with Alert,
  • 03 Targets and Stoploss,
  • No Need to Monitor Individual Scripts.

Accuracy of Scalping Trend

  • Stop Loss Level: 20% Prospect
  • TGT 01 Level: 75% Prospect
  • TGT 02 Level: 60% Prospect
  • TGT 03 Level: 50% Prospect
Scalping Trend Indicator

FEATURES OF INDICATOR

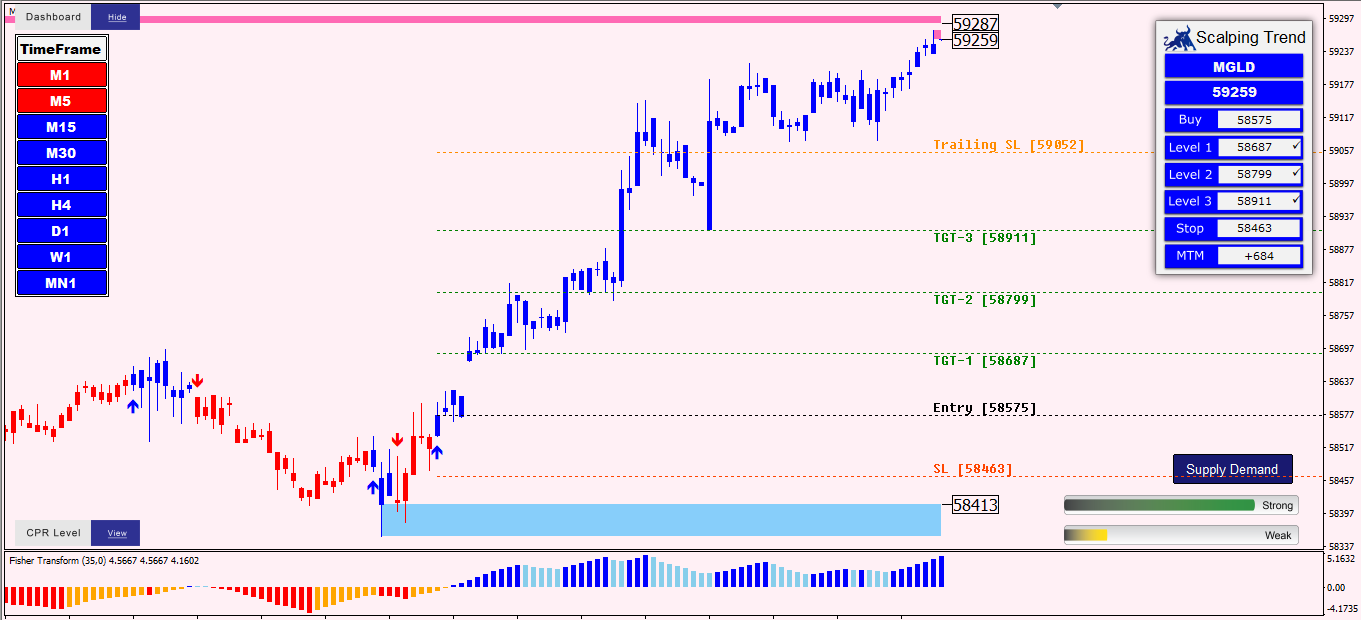
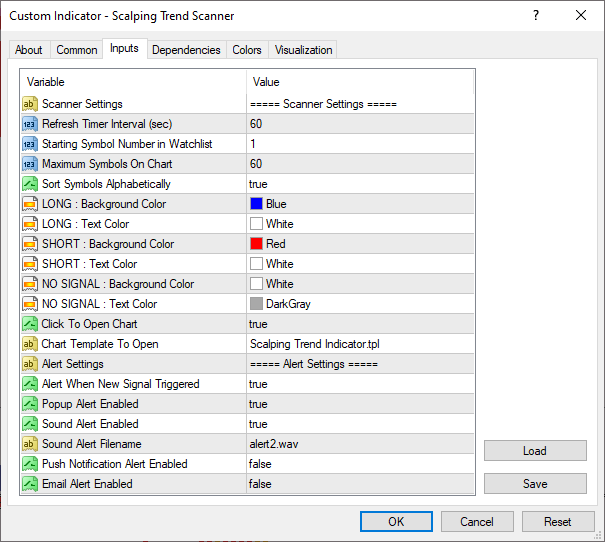
This indicator is a combination of Multiple Indicators. So it gives a better performance. Indicators have all levels shown in the simple charting preview.  You just need to follow the given levels.

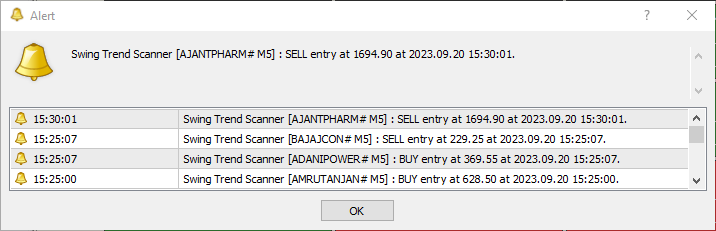
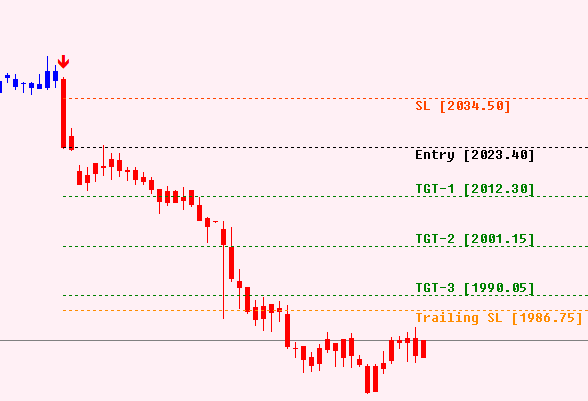
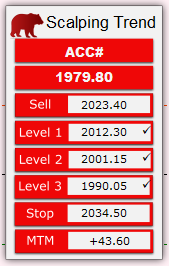
  • Entry Point (Buy/Sell Level) with Alert.
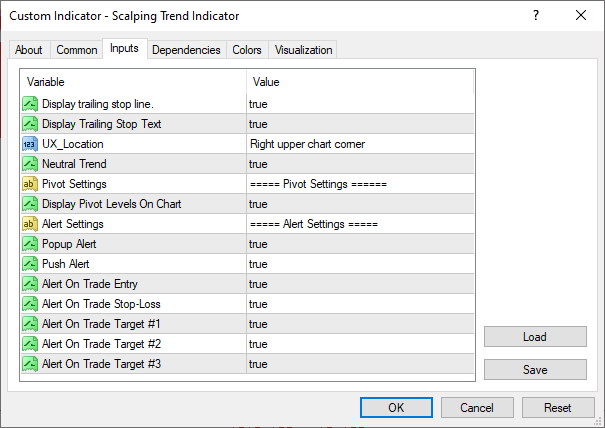
  • TGT 1, TGT 2 Level, TGT 3 & Stop Loss.
  • Trailing Stop Loss -To maximize profit and minimize risk.
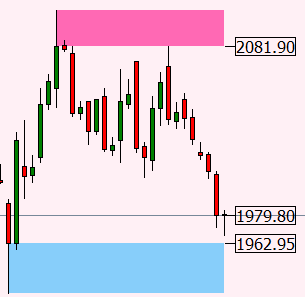
  • Supply Demand for Best Reversal Points (Price Action Based).
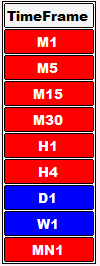
  • Time Frame Scanner for showing Current Signal of all Time Frames.
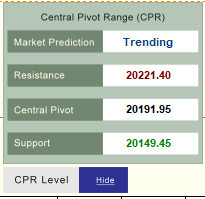
  • Mega Trend for Ultimate Trend Confirmation.
  • Open, High, Low & Close Levels (Daily, Weekly & Monthly).
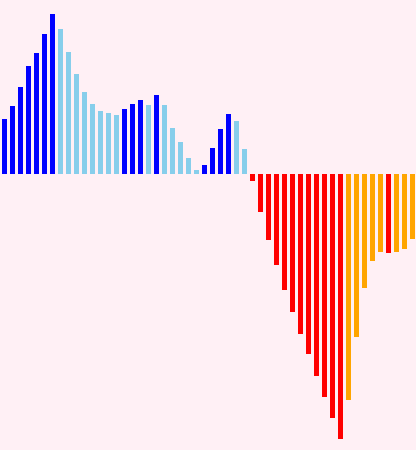
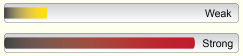
  • Strength Indicator for Current Scalping Trend Forecasting.
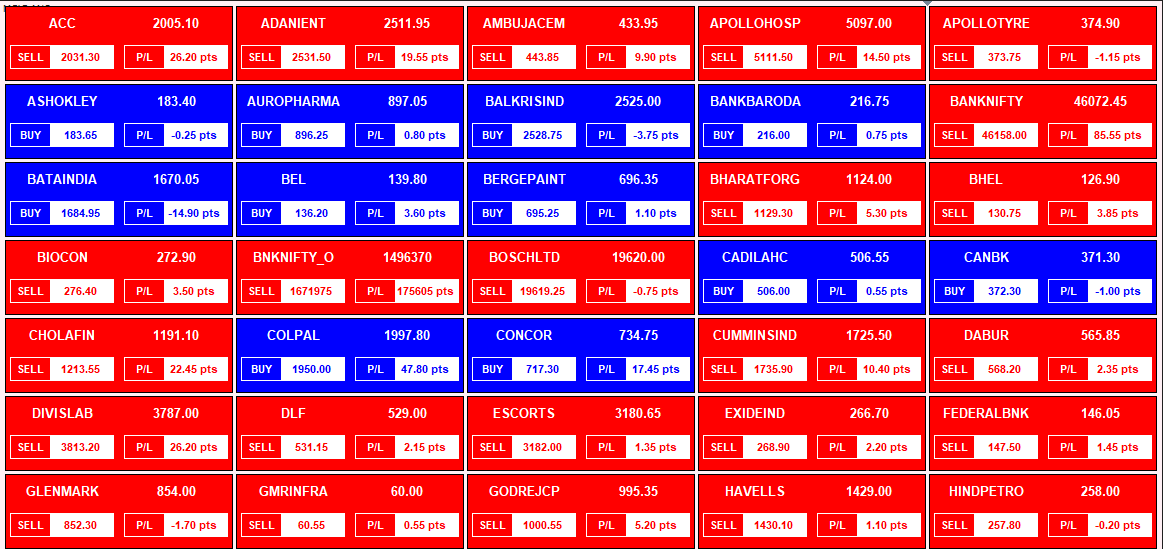
  • Live Movement and P&L Dashboard.
  • Generate Signal for Intraday only.
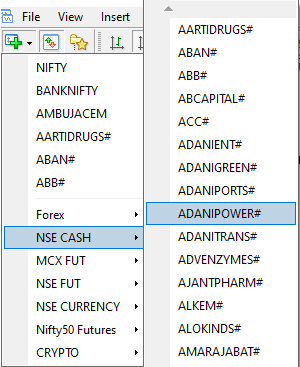
  • Compatible with MCX, NSE-Cash, Futures, Forex, etc.
  • Sound Alert and Popup on new signals,
  • Suited for M5 and M15 Timeframe,
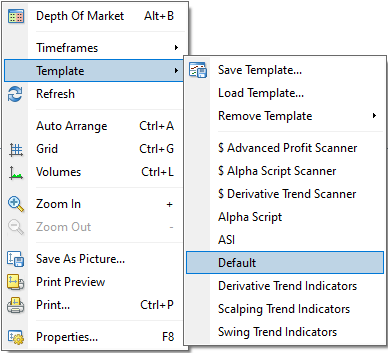
  • The chart with all indicators will open in Single Click.

Pricing of Scalping Trend Scanner

DEMO PURPOSE​

₹1000

₹640

Per month

Billed Monthly
Final Price: ₹640/-
Discount: ₹360/-

REGULAR USER​s

₹1000

₹590

Per month

Billed 03 Monthly
Final PRICE: ₹1770/-
Discount: ₹1230/-

Value Plan

₹1000

₹490

Per month

billed 12 Monthly
Final PRICE: ₹5880/-
Discount: ₹6120

Above Price Includes

  • Scalping Trend Scanner
  • Time Frame Scanner
  • Scalping Trend Indicator
  • Supply Demand Indicator
  • Trend Verifier Indicator
  • Fisher Indicator
  • Mega Trend Indicator
  • Live Market Support
  • Full Scanner Training

How to Use "Scalping Trend Scanner"

Complete Uses, Features and Training Guide.

Table of Contents

Suggested Time Frame (Signals Based)

    • M5: Intraday (Small Targets).
    • M15: Intraday (Medium Targets).
    • M30: BTST/STBT (Big Targets).
    • M1 Not Suggested.
    • Positional: Not Suggested.
    • More than M30: Not Suggested.

Step 01: Open a Chart

  • Open your “Meta Trader 4“
  • Open any new Chart Window-
    • File” > “New Chart > Click on any Chart.

Step 02: Open Scanner

  • Right Click on Chart > “Template > “Scalping Trend Scanner
  • Wait for 20-30 seconds (Do not Click anywhere) 

Scanner Window

  • The Scanner window will open Live this.
  • Now, it will automatically give pop-up alerts on every new signal generated on any script of the scanner.

Alert Window

  • Pop-Up Alert Window will show like this.
  • It will automatically come on the new signal with alert sound.
  • In Alert, the Script Name already mentioned.

Step 03: Open Indicator

  • Click on that script on the scanner. Chart window will open.
  • New Charts window name “Scalping Trend Indicator“.
  • It has many indicators, Now Check all Indicators one by one.

Practice full strategy several times on Paper Trade for Satisfaction.
Complete your full Analysis before taking any stand.

Check 01: All Levels on Chart

  • Check the Arrow Signal and Price Level on Chart.
  • You’ll get a buy/ Sell Level with Three Targets & Stop Loss.
  • Trailing SL will appear after script movement start.
  • You just need to follow the given levels.

But these are Not Enough, Verify the signals with Other Indicators.

Check 02: Time Fame Scanner

  • Time Frames are available 01 Minute to 01 Month.
  • Check the Current Time Frame & One Lower Time frame.
  • Both should be the same like
    • If trade on M5 then M1 will also be in same color.
    • Like M5 in Red Color & M1 in Red Color.
    • If Color not same then wait till becomes into same.

Check 03: Trend Indicator

  • The Red and Blue Bar is a Trend Indicator.
  • Red: Strong Bearish and Light Red: Weak Bearish.
  • Blue: Strong Bullish and Light Blue: Weak Bearish
  • Trend Must Match the Current Signal like
    • If Arrow is Up Side then Dot Line must be in Bule Color.
    • If Arrow is Down side then Dot Line must be in Red Color.
    • If Color is not the same then wait till becomes into same.

Check 04: Supply Demand (Most Important)

Supply Demand is Pure Price Action Based Indicator.

  • Red is Supply Zone and Blue is Demand Zone. These Zones work as Reversal Points like
    • If candle hit Supply Zone refers a good possibility of reversing the trend to Down Side.
    • If candle hit Demand Zone refers a good possibility of reversing the trend to Up Side.
  • Feature: One Click Show / Hide Button is available on the bottom right Corner on chart.
  • Remember, If candle is going to hit any zone
    • You need to keep eye on script that time. It can be reversed.
    • If the Price Reverses, Exit immediately.
    • If Price Break Zone, Keep Open Position for Next Level.
  • If found very Low gap between Supply & Demand, if refers
    • Sideway Market Condition (No Trade Zone) or
    • Range Bound Market Condition (No Trade Zone).
    • Wait till break any Zone.

Other Feature: Current Strength

  • Red Refers to Bearish and Green Refers to Bullish.
  • The indicator shows the Current Strength of Signal Like
    • Strong, Medium and Week.

Other Feature: Central Pivots Range (CPR)

  • Red Refers to Resistance and Green Refers to Support.
  • Black Refers to Central Pivot Level.
  • The Dashboard shows you the Levels like
    • Central Pivot, Resistance, Support and Market Prediction.
  • Feature: One Click Show / Hide Button
    • Available on the Bottom Left Corner.

Other Feature: Dashboard

  • Red Refers to Bearish and Blue Refers to Bullish.
  • The Dashboard shows you the Levels like
    • Buy / Sell, TGT 1, TGT 2, TGT 3, Stop Loss and MTM.
  • Feature: One Click Show / Hide Button
    • Available on the Top Left Corner on chart.

Settings: Scanner

  • First Open Scanner from Templates.
  • Right Click on Chart > Indicators List,
  • Double Click on Scalping Trend Scanner > Inputs,
  • Double Click for Edit any Section,
  • Do Required Changes like
    • Color, Starting Number, Max Symbol, Alerts, etc.
  • Now Click OK > Close.
  • Scanner will open with New Settings in 30 seconds.

Settings: Indicator

  • First Open Indicator from Templates.
  • Right Click on Chart > Indicators List,
  • Double Click on Scalping Trend Indicator> Inputs,
  • Double Click for Edit any Section.
  • Do Required Changes like
    • UX Location, Alerts, Trilling SL, etc.
  • Now Click OK > Close.
  • Indicator will open with New Settings in 10 seconds.

Points Keep in Mind

  • Never Open the Scanner in Multiple Charts / Tabs.
  • Do not open unnecessary charts.
  • Close all charts before closing MT4.
  • In case of Software hangs, Restart MT4 then Close all charts.
  • In case of New Installation, Software may slow for 2-3 Days.
  • While opening Scanner, Wait for 20-30 Seconds for opening Scanner.

Scanner Not Working or any Error

If you got any error Like "Blank Screen" or "License check failed!" or "Activation check failed". Let's try to fix it.
  1. Check Internet Connection (If Internet Working)
    • Close all Charts and Then Open a new Chart.
  2. Final Check: Check the Subscription Expiry Date.
    • If Subscription Expired, Renew Immediately.
    • If Not Expired: Complain us on WhatsApp.

Thank You for Reading. Have a Great Day! 😊

Scan & Pay

UPI ID

G-Pay/ Paytm