
Prime Magic Strategy
One Strategy work for Scalping, Intraday & Short Term Positional.
Strategy - Main Features
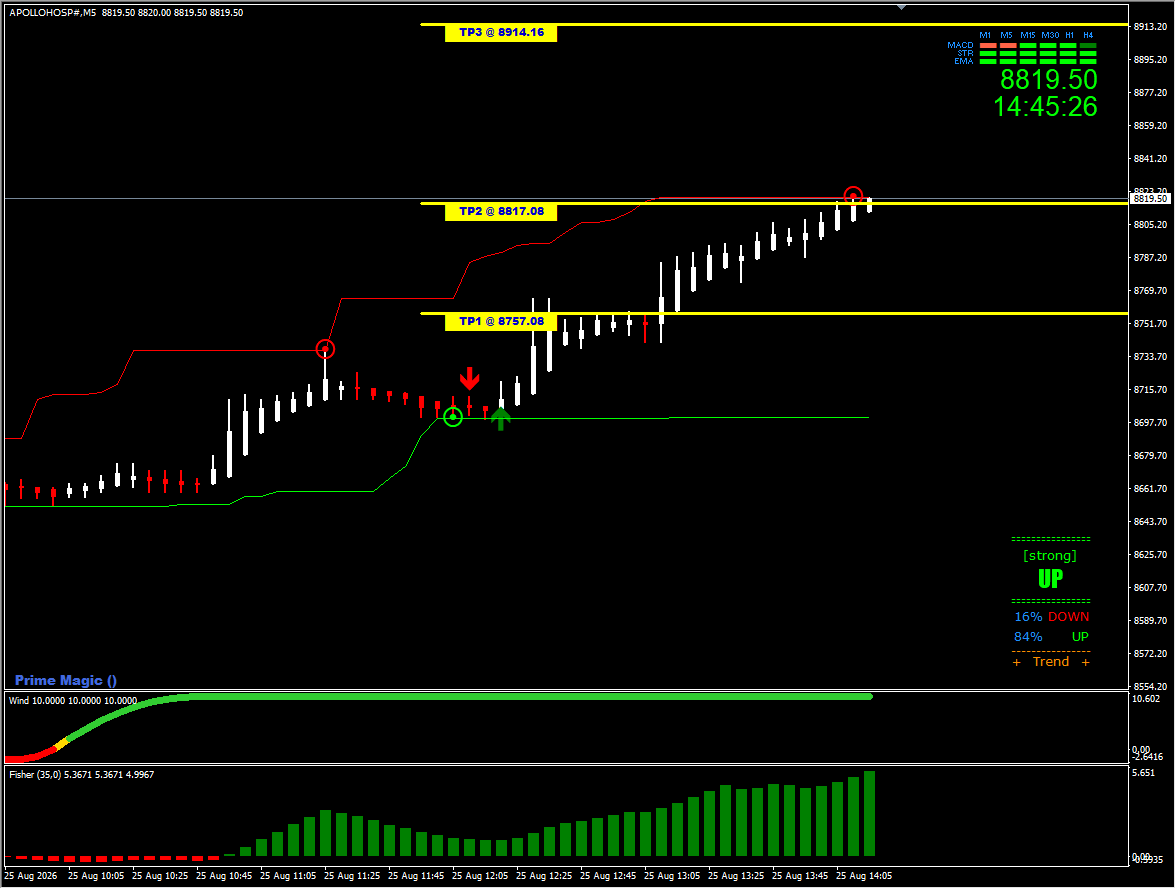
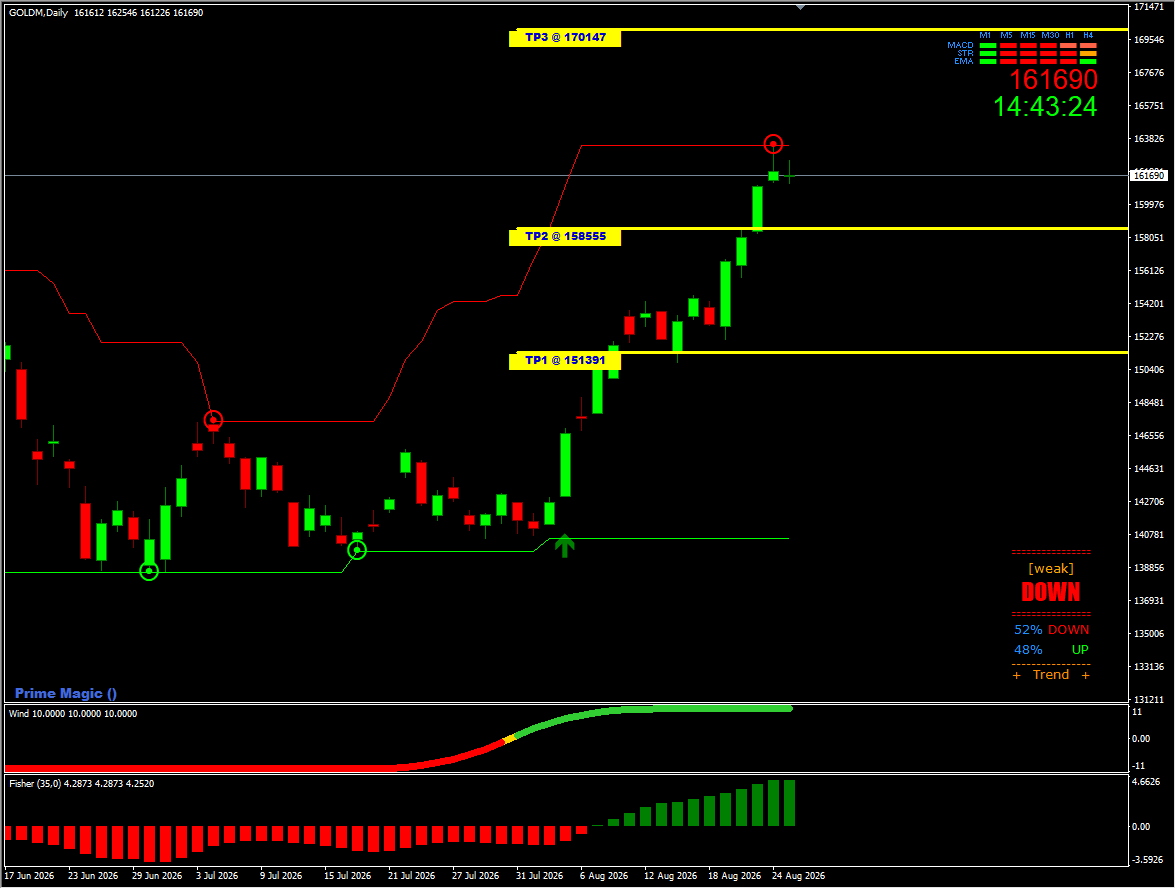
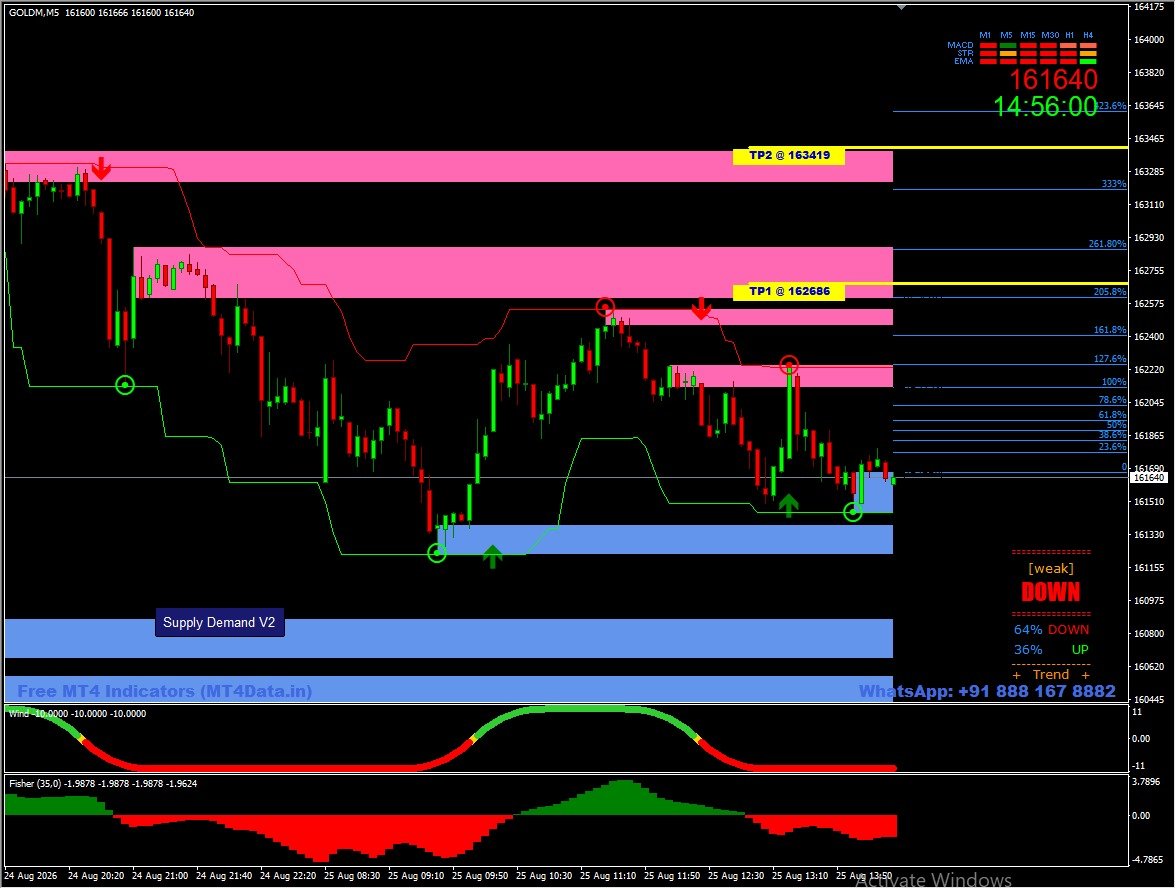
- Show Buy & Sell Levels with Line Plotted on Chart.
- Give 03 Targets & a Perfect Stoploss.
- Shows Trailing Stoploss for Maximize Profit and Minimizing Risk.
- Shows Supply & Demand Levels (Reversal Zones).
- Shows Current Trend of Stocks.
- Sound Alert and Popup on new signals.
Accuracy of Strategy
- TGT 01 Level: 80% Prospect
- TGT 03 Level: 50% Prospect
- TGT 02 Level: 60% Prospect
- Stop Loss Level: 15% Prospect
Compatible Devices...
- Windows Laptop / Desktop
- Apple (MAC OS) Laptop / Desktop
Supported Trading...
- Intraday
- Cash
- MCX
- Scalping
- Future
- Currency
- Swing
- Index Option
- Forex
- Positional
- MCX Option
- Crypto
Pricing of Prime Magic Strategy
Strategy for Lifetime @ ₹ 4,900/- without data.
Above Price Includes
- Prime Magic Strategy
- Supply Demand Indicator
- Mega Trend Indicator
- Fisher Indicator
- Live Market Support
- Full Training
How to Use "Prime Magic Strategy"
Complete Uses, Features and Training Guide.
Table of Contents
Suggested Time Frame (Signals Based)
- M1: High Risk (Use in Range Bound Only).
- M05: 3-4 Signals in a Day
- M15: 1-2 Signals in a Day
- M30: 3-5 Days Holdings
- H1: 3-10 Days Holdings
- H4: 7-15 Days Holdings
- D1: 15-30 Days Holdings
- W1 / MN: >30 Days (Check Fundamentals).
Repeatedly practice your entire strategy through Paper Trading to ensure satisfaction.
Ensure you have completed a thorough analysis before making any decisions.
Open a Chart
- Open your “Meta Trader 4“ Software
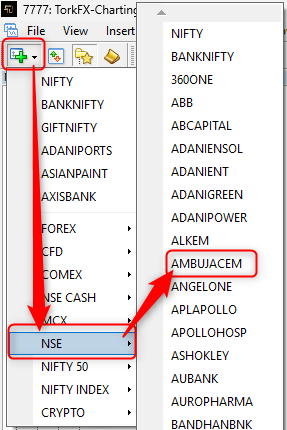
- Open any new Chart Window-
- “File” > “New Chart” > Click on any Chart.
Indicator Window
- New Charts window name “Prime Magic“.
- Else, Right Click on Chart > “Template” > “Prime Magic”
- It has many indicators, Now Check all Indicators one by one.
Alert Window
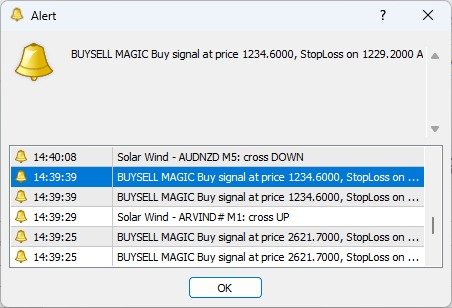
- Pop-Up Alert Window will show like this.
- It will automatically appear on the new signal with alert sound.
- In Alert, the Script Name already mentioned.
Check 01: All Levels on Chart
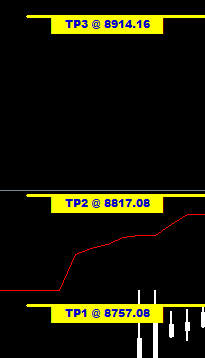
- Check the Signal and Price Level on Chart.
- You’ll get a Buy/ Sell Level with Three Targets & Stop Loss.
- You just need to follow the given levels.
But these are Not Enough, Verify the signals with Other Indicators.
Check 02: Trend Indicator
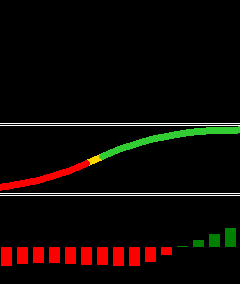
The Red and Green Line is a Trend Indicator.
- Red refers Bearish and Green refers Bullish.
- Trend Must Match the Current Signal like
- If Arrow is Up Side then Line must be in Green Color.
- If Arrow is Down Side then Line must be in Red Color.
- If Color is not same, wait till becomes into same.
Check 03: Supply Demand (Most Important)
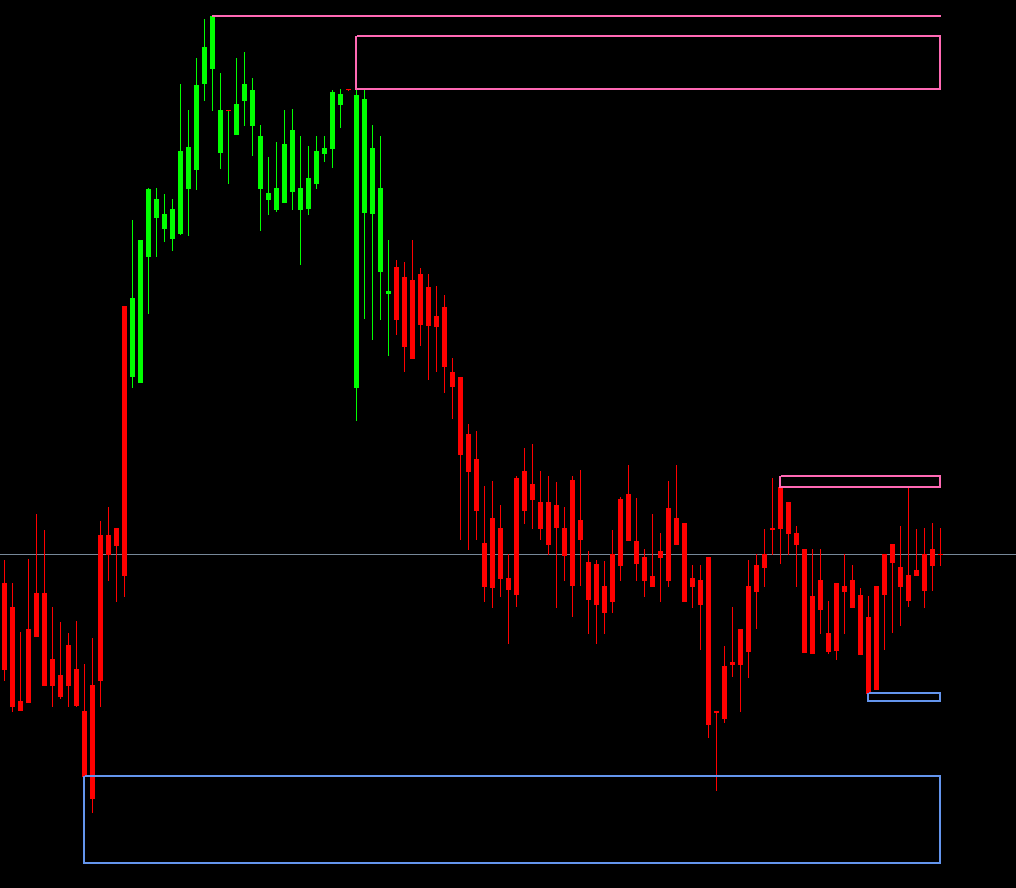
Supply Demand is Pure Past Price Action Based Indicator.
- Red is Supply Zone and Blue is Demand Zone. These Zones work as Reversal Points like
- If candle hit Supply Zone refers a good possibility of reversing the trend to Down Side.
- If candle hit Demand Zone refers a good possibility of reversing the trend to Up Side.
- Feature: One Click Show / Hide Button is available on the bottom right Corner on chart.
- Remember, If candle is going to hit any zone
- You need to keep eye on script that time. It can be reversed.
- If the Price Reverses, Exit immediately.
- If Price Break Zone, Keep Position Open for Next Level.
- If found very Low gap between Supply & Demand, it refers
- Sideway Market Condition (No Trade Zone) or
- Range Bound Market Condition (No Trade Zone).
- Wait till break any Zone.

Strategy Not Working or any Error
- Error Like
- Blank Screen.
- License check failed.
- Activation check failed.
- Let’s try to fix it…
- Check 01: Close all Charts and Then Open a new Chart.
- Check 02: Check your Internet Connection.
- Final Check: Check the Subscription Expiry Date.
If the subscription has expired, renew it Immediately.
If not expired, please lodge a complaint with us on WhatsApp.
Key Points to Remember
- Open the chart of the specified stock or commodity, where levels such as entry, targets, and stop-loss (SL) are indicated.
- Ensure the signal matches the trend line direction.
- If the signal & trend line, the entry is considered safe.
- Another important indicator is supply and demand,
- Which act as reversal points.
- Verify that no supply or demand zones are present between the entry point and Target 01 Level,
- as these could indicate potential price reversals. If any supply or demand is detected, monitor closely;
- if the price hits and reverses from that zone, exit the position.
- If the price breaks through the zone, you may consider entering a position for the next level.
- Always set a stop loss.
- Set Stop Loss according to given level on chart.
- Modify Stop loss according to the trailing SL line plotted on the chart. Else,
- Once the current price reaches Target 01, update the entry level as the new stop loss.
- If you got any error Like “Blank Screen” or “License check failed!” or “Activation check failed”.
- Close all Charts and Then Open a new Chart.
- Check your Internet Connection.
- Check the Subscription Expiry Date.
- Still not Fixed, Infrom us on Whatsapp +91 888 167 8882.