Key Features:
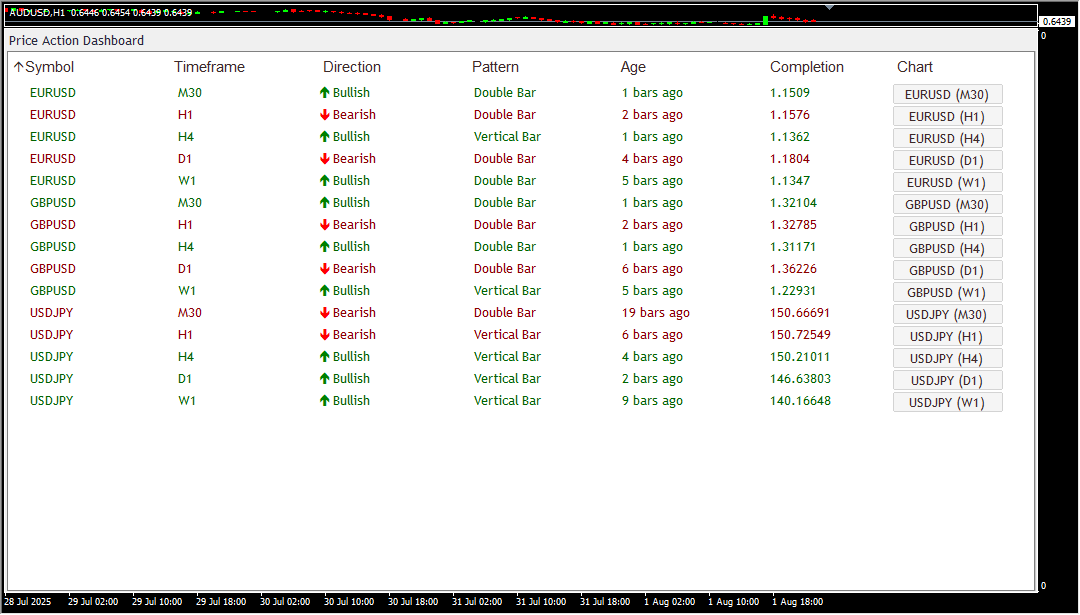
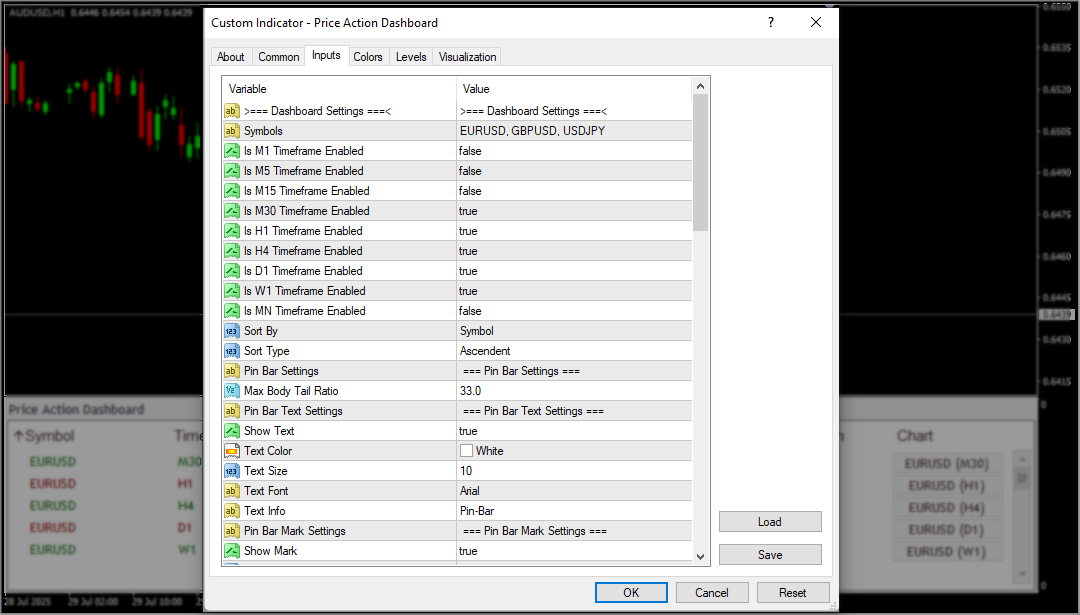
Scan Multiple Scripts & Timeframes at Once
Monitor multiple charts across timeframes — from 1 minute to 1 month — simultaneously and automatically.
Identify Strong Market Turning Points
Detect powerful reversal and continuation signals based purely on price structure, with no lagging indicators.
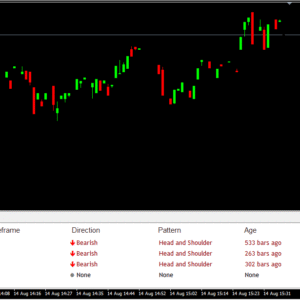
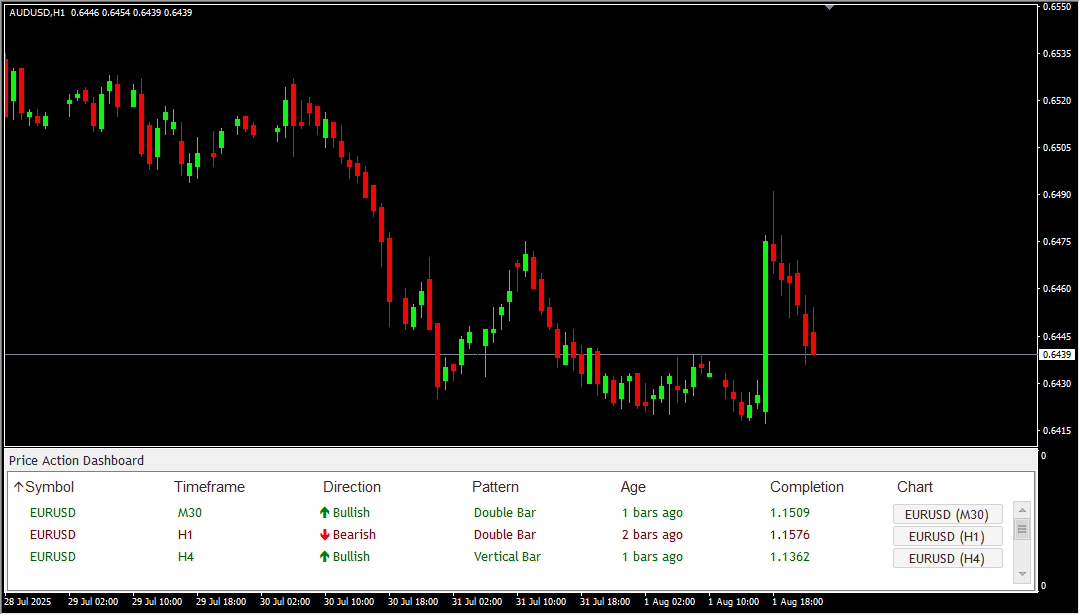
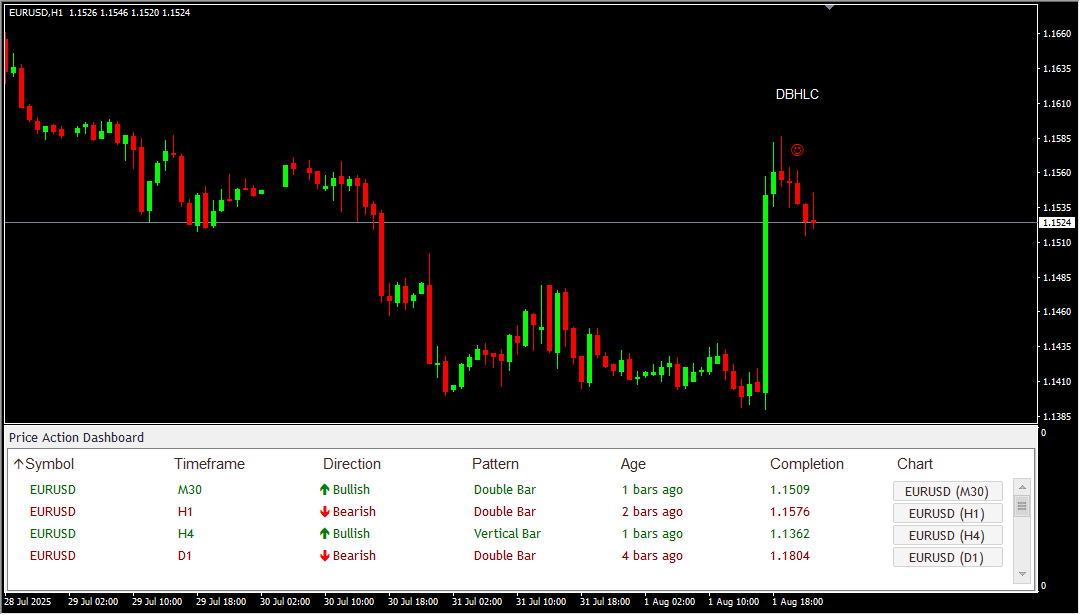
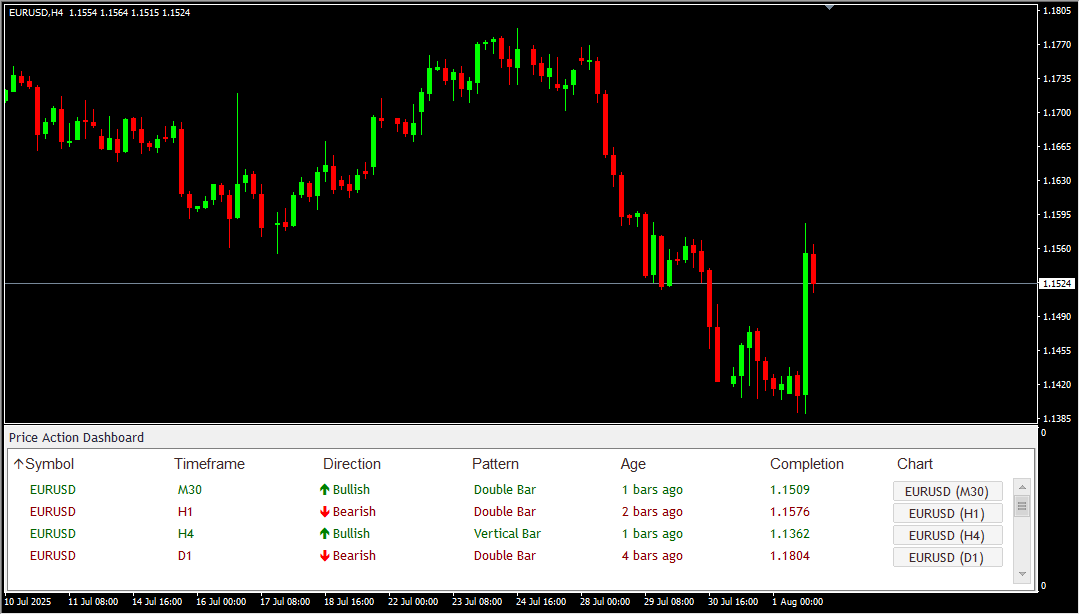
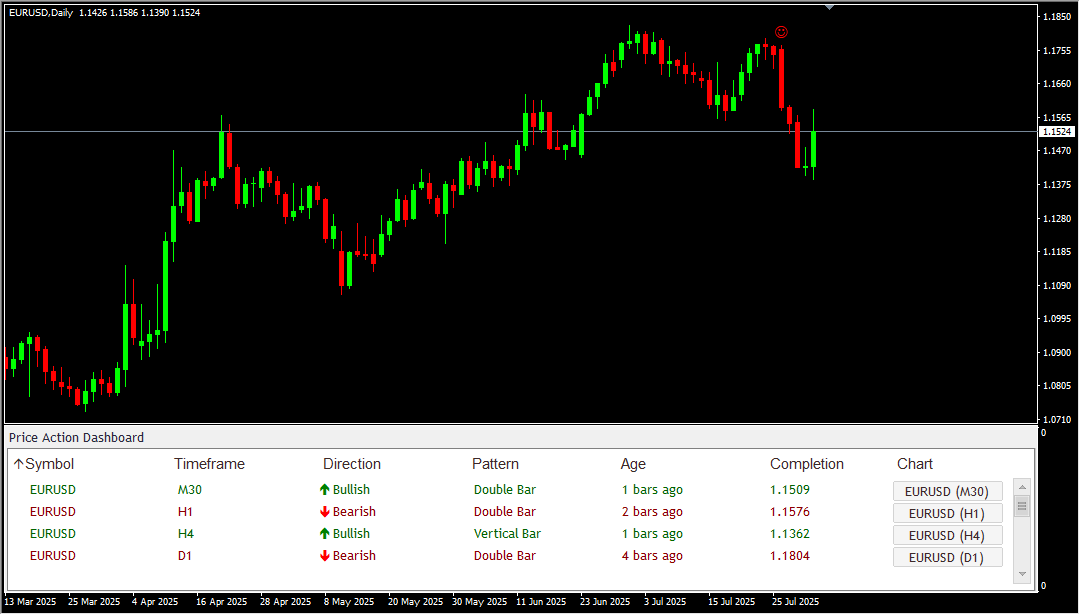
All-in-One Price Action Dashboard
View every detected signal across instruments and timeframes in one centralized, sortable dashboard.
Recognizes Key Price Action Setups Automatically
Detects a wide range of high-probability signals:
- Pin Bar Price Action – Classic rejection candle patterns
- Double Bar Price Action – Inside/outside bar structures for breakout or reversal
- Vertical Bar Price Action – Significant momentum candles indicating trend shift
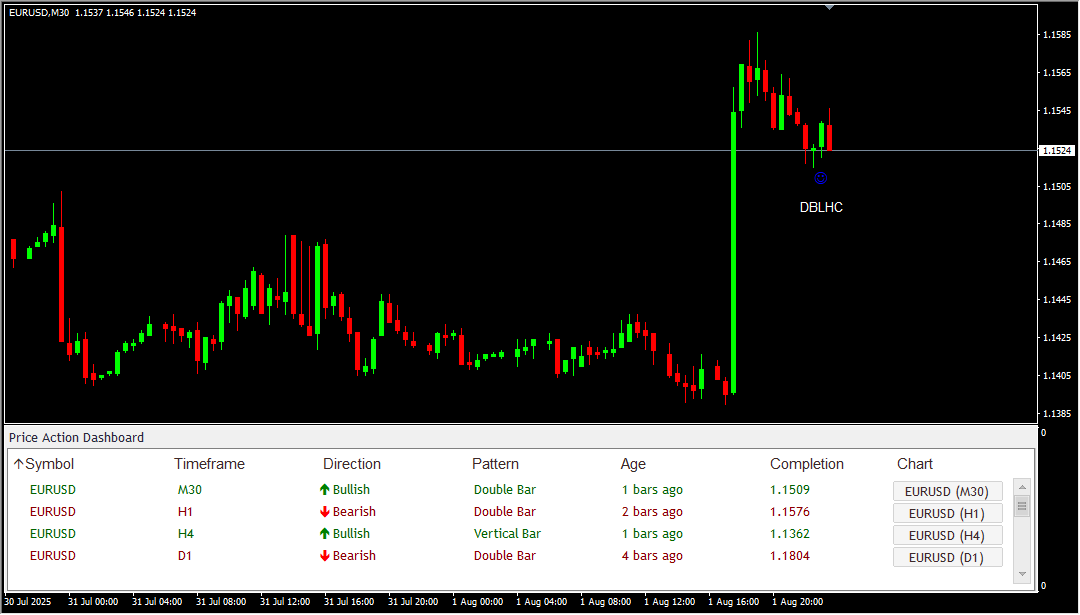
Visually Appealing Chart Markings
Patterns are clearly drawn on the chart — with highlighted zones and entry-level indications — so you never miss the context.
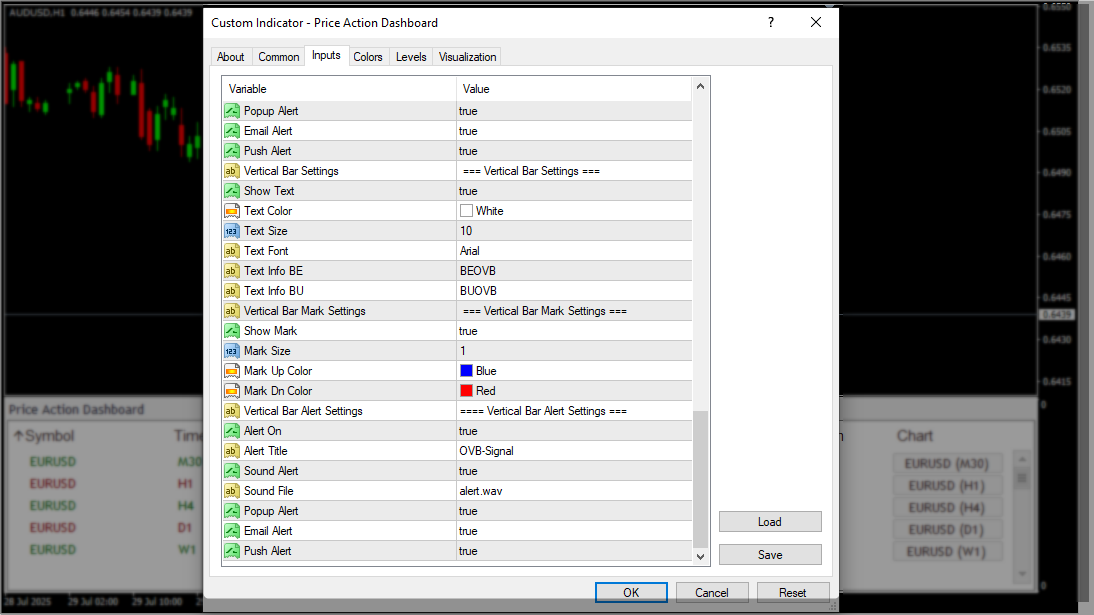
Real-Time Alerts on Signal Formation
Be instantly notified through:
- ️ Pop-up alerts
- Sound alerts
- Email notifications
- Push notifications to your mobile
️ Single-Click Chart Opening
Click once from the dashboard to view the exact chart and timeframe where the signal appeared — instantly ready for action.
Sort and Filter the Dashboard
Organize signal data by:
- Symbol
- Timeframe
- Direction (Bullish/Bearish)
- Age of Signal (newest to oldest)
No Need for Manual Monitoring
Let the dashboard do the heavy lifting while you focus on strategy, timing, and execution.
⏱️ Suited for All Timeframes
Whether you trade short-term scalps or long-term swings, it works across 1-minute to 1-month charts.