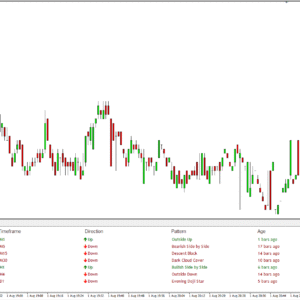
Dashboard Simplifies Everything
The intuitive dashboard is designed to take the heavy lifting off your shoulders. It continuously scans and monitors market data in real time, automatically detecting complex harmonic patterns as they form. With intelligent algorithms working behind the scenes, you don’t need to spend hours analyzing charts manually—the dashboard does it all for you, saving time and increasing efficiency.
⏱️ Scan Multiple Timeframes Simultaneously
No need to limit your analysis to a single view. The scanner allows you to simultaneously scan multiple instruments across various timeframes, ranging from 1-minute charts all the way up to 1-month intervals. This feature is especially valuable for traders who monitor both short-term price movements and long-term trends, enabling a complete market overview at a glance.
Instant Pattern Identification
As soon as a harmonic pattern is identified, the dashboard highlights it instantly—no delays, no guesswork. The visual interface clearly shows the pattern’s structure, name (like Gartley, Bat, or Butterfly), and position, allowing you to make informed decisions quickly. This real-time pattern detection gives you a competitive edge by capturing setups as they emerge.
⏰ Effective Across All Timeframes
Whether you’re a scalper working with minute-by-minute data, a swing trader analyzing daily patterns, or a long-term investor looking at monthly charts, the scanner adapts to your strategy. It maintains accuracy and effectiveness across all timeframes, providing consistent support for your trading decisions.
Customizable Alerts for Every Signal
Never miss an important setup again. With fully customizable alerts, you can choose how you’re notified the moment a pattern is detected. Alerts can be delivered in the form of:
- On-screen pop-up notifications
- Audible sounds
- Instant email messages
- Push notifications to your mobile device
These options ensure that you stay updated no matter where you are or how you prefer to receive information.
➡️ Quick Access to Relevant Charts
With just one click, you can jump directly from the dashboard to the chart associated with any signal. This streamlined access helps you act swiftly, reducing the time spent navigating between tools and enhancing your responsiveness to market conditions.
️ Flexible Sorting Options for Easy Navigation
Customize your dashboard view to suit your needs. You can sort the detected patterns and signals based on:
- Symbol or instrument name
- Timeframe of the chart
- Direction of the pattern (bullish or bearish)
- Age of the signal (how recently it was identified)
These flexible sorting options help you quickly zero in on the most relevant opportunities without getting overwhelmed.